Data plot interactivity
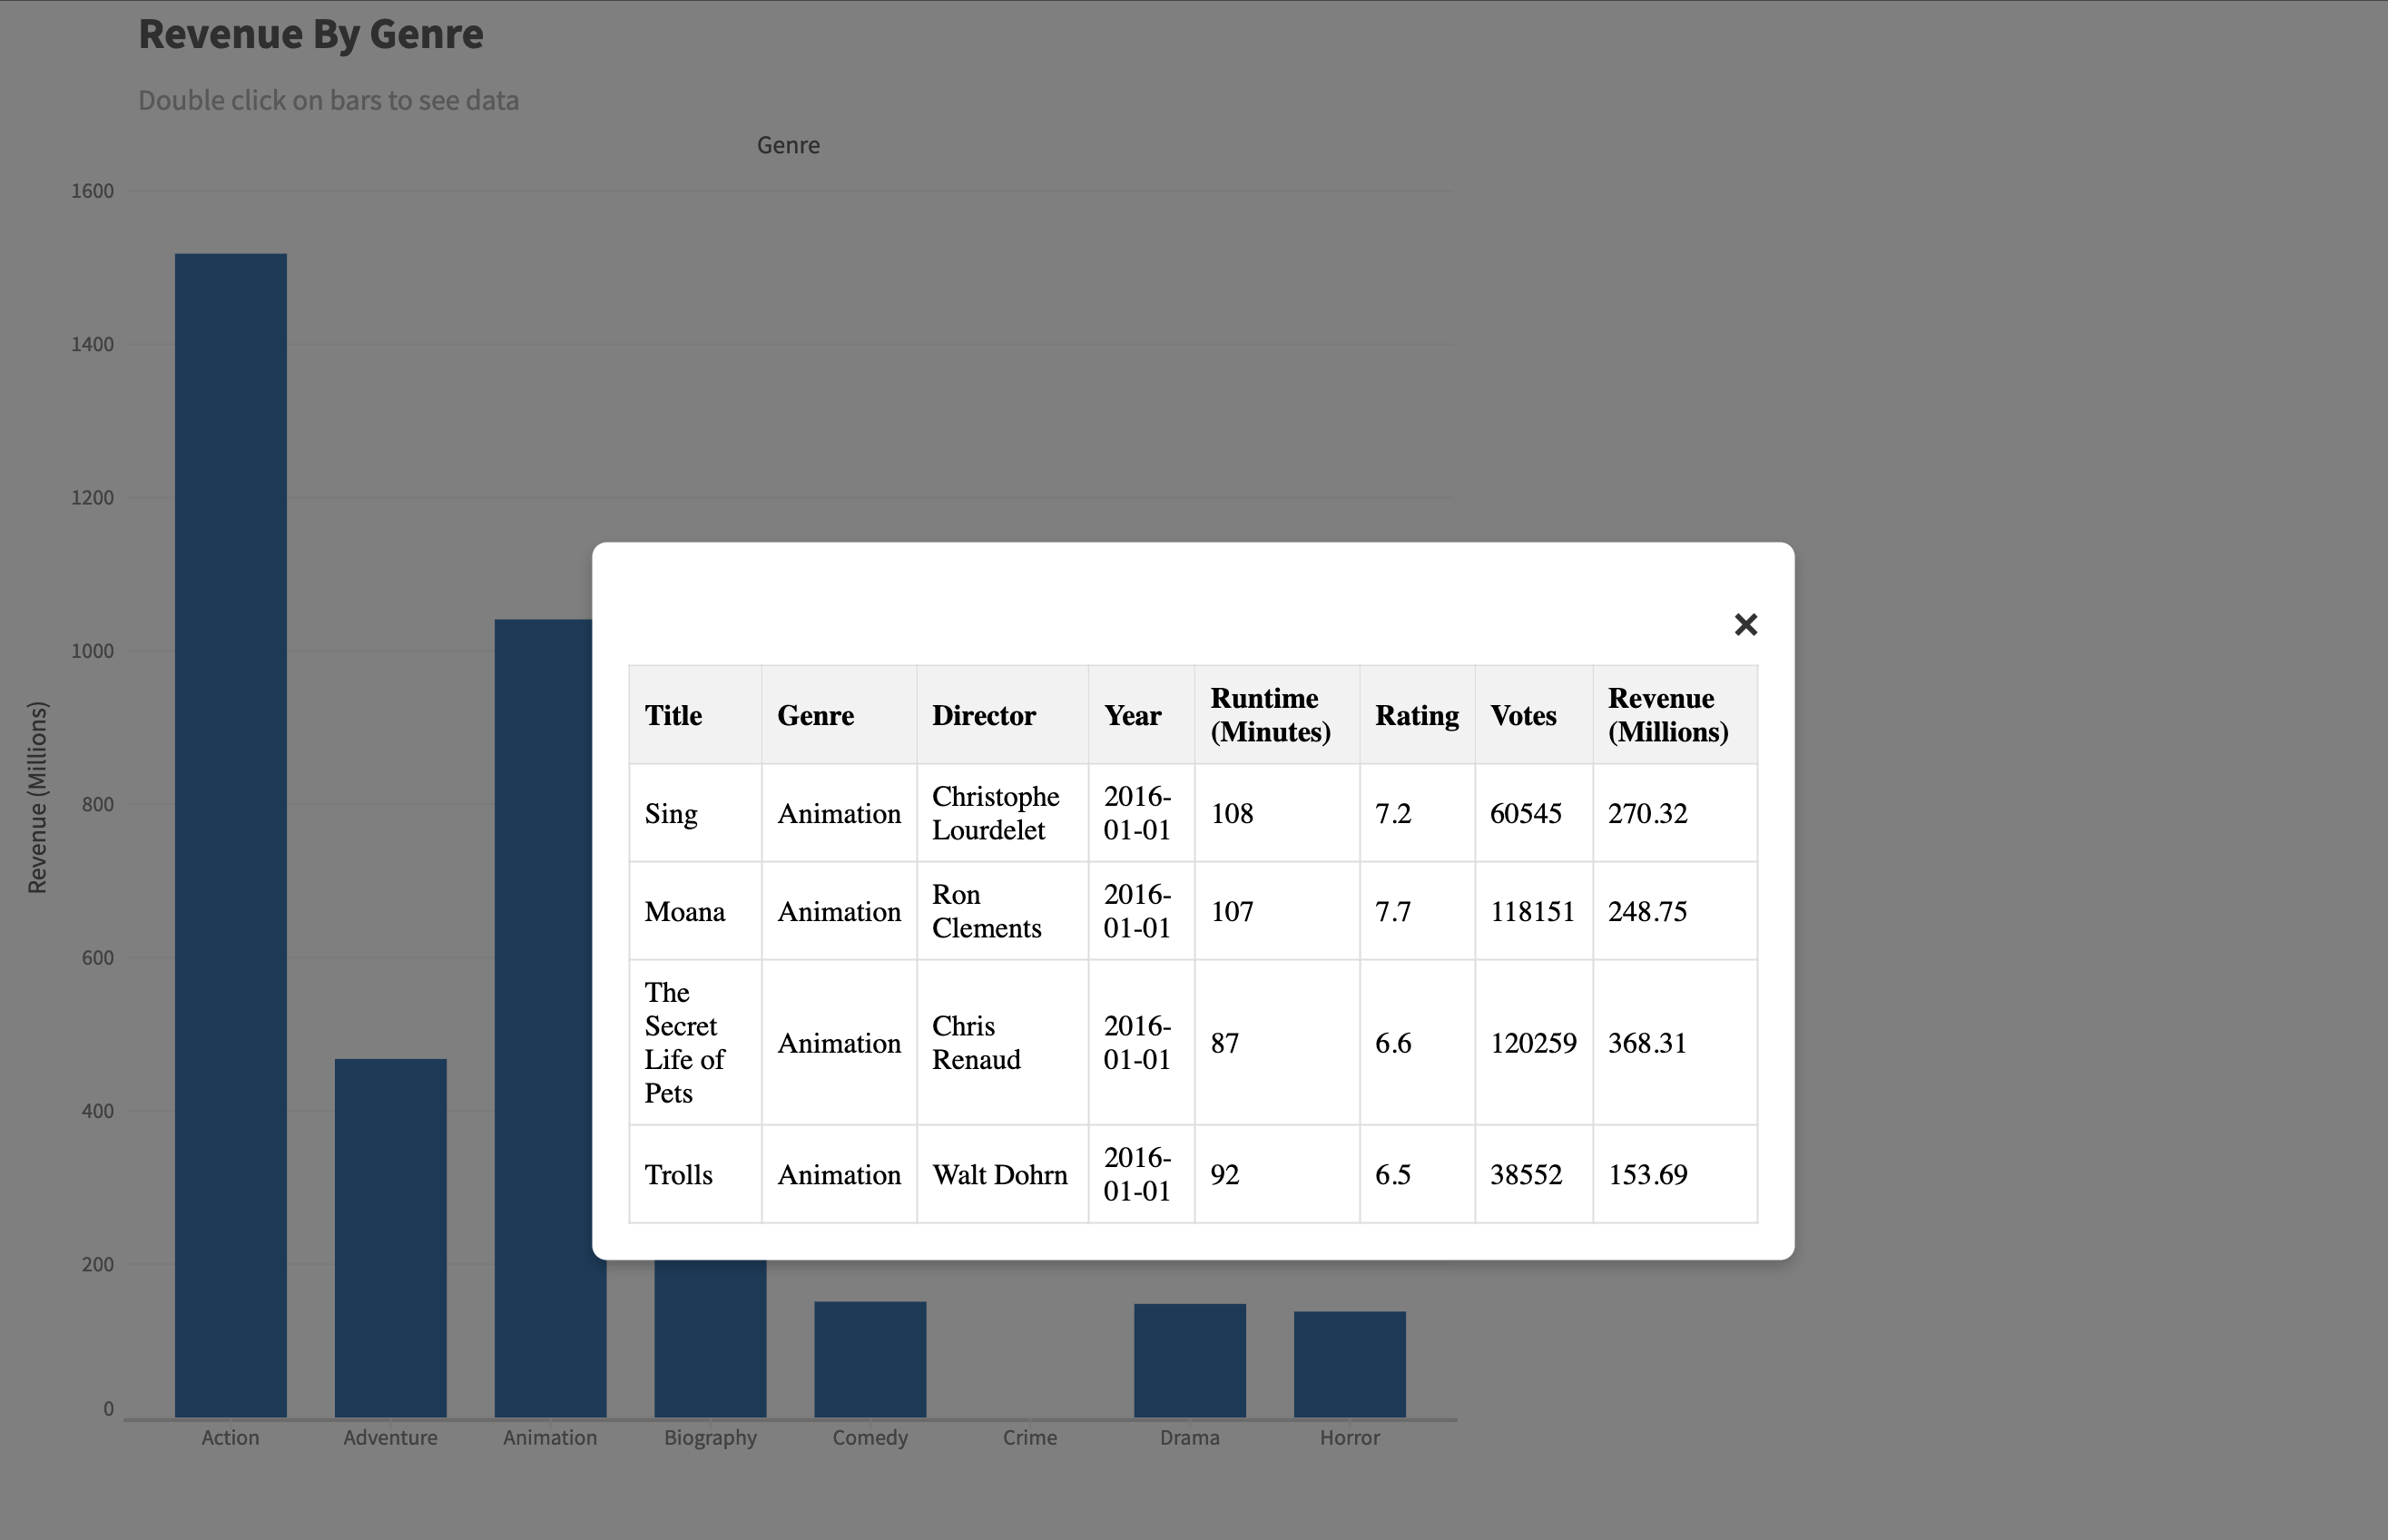
In this tutorial, we will show how you can show a DataGrid on double click interaction. This is the final view of the chart with the interaction and the data grid. We will explain it step by step from here.
Create the chart
First, let's create the chart:
muze
  .canvas()
  .rows(["Revenue (Millions)"])
  .columns(["Genre"])
  .title("Revenue By Genre")
  .subtitle("Double click on bars to see data")
  .data(dm)
  .mount("#chart");
Attaching a physical action
Now, let's create a physical action for doubleclick event and register it in ActionModel:
muze.ActionModel.for(canvas).registerPhysicalActions({
  /* to register the action */
  doubleClick: (firebolt) => (targetEl) => {
    targetEl.on("dblclick", function (data) {
      const event = muze.utils.getEvent();
      const mousePos = muze.utils.getClientPoint(this, event);
      const payload = firebolt.getPayloadFromEvent("doubleClick", mousePos, {
        data,
        event,
      });

      firebolt.triggerPhysicalAction("doubleClick", payload);
    });
  },
});
Creating a singleSelect behaviour
Now, we will create a singleSelect behaviour class and extend VolatileBehaviour. Behavioural Action creates an entry set which contains the data which we have selected and exit set containing the data which are not selected. VolatileBehaviour creates the entry set with only the last item selected and adds the rest to the exit set.
Then we give a formalName to this behaviour. Giving formalName is important as through this name the behaviour will be identified when we map it to the physical action.
muze.ActionModel.for(canvas).registerBehaviouralActions(
  class SingleSelectBehaviour extends VolatileBehaviour {
    static formalName() {
      return "singleSelect";
    }
  },
);
Now let's map this behaviour with the doubleClick physical action:
.registerPhysicalBehaviouralMap({
    doubleClick: {
        behaviours: ['singleSelect']
    }
})
Creating a grid side effect
Now, we will create a side effect which will show the DataGrid on interaction. For that, we need to create a class named DataGrid and extend the SpawnableSideEffect class. We will also set the formalName of the side effect:
    .registerSideEffects(
      class DataGrid extends SpawnableSideEffect {
        static formalName() {
          return "data-grid";
        }

        apply(selectionSet) {
        }
      }
    )
We need to implement the apply method of the side effect which will show the DataGrid. The apply method receives the selectionSet object which contains the entry set and exit set of the data. The DataModel instance of entry set will contain the data of the selected items. So, we filter the full DataModel instance which we had passed to canvas with the data of the selected item. Then, we retrieve the data from the DataModel instance and use it to render our DataGrid.
apply(selectionSet) {
    const model = selectionSet.entrySet.model;
    if (!model) {
        removeDataGrid();
        return this;
    }

    const selectDm = canvas.data().select({
        field: canvas.columns()[0],
        value: model.getField(canvas.columns()[0]).data()[0],
        operator: "eq",
    });
    const { data, schema } = selectDm.getData({
        excludeFields: ["__id__"],
    });

    // Format the data
    formatData(data);

    // Dispose the datamodel
    selectDm.dispose();

    // Show table
    showDataGrid({ data, schema }, canvas);
    }
NOTE: Here, model is not a DataModel instance, it's a wrapper over DataModel instance which is internally created by Muze to add additional functionalities.
The showDataGrid is a custom function responsible for rendering our DataGrid. For rendering the table view, we will create simple HTML table and add styles.
function showDataGrid({ data, schema }, canvas) {
  removeDataGrid();

  // Get chart container
  const chart = document.getElementById("chart");

  // Create modal container
  const modal = document.createElement("div");
  modal.id = "modal";
  modal.style.position = "fixed";
  modal.style.top = "50%";
  modal.style.left = "50%";
  modal.style.transform = "translate(-50%, -50%)";
  modal.style.backgroundColor = "white";
  modal.style.padding = "20px";
  modal.style.boxShadow = "0 4px 8px rgba(0, 0, 0, 0.2)";
  modal.style.zIndex = "1000";
  modal.style.borderRadius = "8px";
  modal.style.overflow = "hidden";
  modal.style.maxHeight = "50%";
  modal.style.display = "flex";
  modal.style.flexDirection = "column";

  // Create close button
  const closeIcon = document.createElement("span");
  closeIcon.innerHTML = "×";
  closeIcon.style.position = "sticky";
  closeIcon.style.top = "0";
  closeIcon.style.right = "0";
  closeIcon.style.margin = "10px 0";
  closeIcon.style.fontSize = "24px";
  closeIcon.style.fontWeight = "bold";
  closeIcon.style.cursor = "pointer";
  closeIcon.style.alignSelf = "flex-end";
  closeIcon.style.color = "#333";
  closeIcon.style.zIndex = "1001";
  closeIcon.onclick = () => {
    chart.removeChild(overlay);
    canvas.firebolt().dispatchBehaviour("singleSelect", {
      criteria: null,
    });
  };

  modal.appendChild(closeIcon);

  // Create table container
  const tableContainer = document.createElement("div");
  tableContainer.style.overflowY = "auto";
  tableContainer.style.flex = "1";

  // Create table
  const table = document.createElement("table");
  table.id = "table";
  table.style.width = "100%";
  table.style.borderCollapse = "collapse";

  // Add table headers
  const thead = document.createElement("thead");
  thead.style.position = "sticky";
  thead.style.top = "0";
  thead.style.backgroundColor = "#f2f2f2";
  thead.style.zIndex = "1001";

  const headers = schema.map((d) => d.name);
  const headerRow = document.createElement("tr");
  headers.forEach((header) => {
    const th = document.createElement("th");
    th.textContent = header;
    th.style.border = "1px solid #ddd";
    th.style.padding = "8px";
    th.style.textAlign = "left";
    headerRow.appendChild(th);
  });
  thead.appendChild(headerRow);
  table.appendChild(thead);

  // Add table rows
  const tbody = document.createElement("tbody");
  data.forEach((row) => {
    const tr = document.createElement("tr");
    row.forEach((cell) => {
      const td = document.createElement("td");
      td.textContent = cell;
      td.style.border = "1px solid #ddd";
      td.style.padding = "8px";
      tr.appendChild(td);
    });
    tbody.appendChild(tr);
  });
  table.appendChild(tbody);

  tableContainer.appendChild(table);
  modal.appendChild(tableContainer);

  // Create overlay
  const overlay = document.createElement("div");
  overlay.id = "overlay";
  overlay.style.position = "fixed";
  overlay.style.top = "0";
  overlay.style.left = "0";
  overlay.style.width = "100%";
  overlay.style.height = "100%";
  overlay.style.backgroundColor = "rgba(0, 0, 0, 0.5)";
  overlay.style.zIndex = "999";

  overlay.appendChild(modal);
  chart.appendChild(overlay);
}
Map the side effect with the behavioural action
Finally, we map the side effect with the singleSelect behaviour so that it gets dispatched whenever the singleSelect behaviour is called. We add this in the canvas.config().
.config({
    interaction: {
      singleSelect: {
        sideEffects: {
          "data-grid": {
            enabled: true,
          },
        },
      },
    },
  })
Example
const { muze } = viz;

const data = `"Title","Genre","Director","Year","Runtime (Minutes)","Rating","Votes","Revenue (Millions)"
"Guardians of the Galaxy","Action","James Gunn","2014-01-01","121","8.1","757074","333.13"
"Prometheus","Adventure","Ridley Scott","2012-01-01","124","7","485820","126.46"
"Split","Horror","M. Night Shyamalan","2016-01-01","117","7.3","157606","138.12"
"Sing","Animation","Christophe Lourdelet","2016-01-01","108","7.2","60545","270.32"
"Suicide Squad","Action","David Ayer","2016-01-01","123","6.2","393727","325.02"
"The Great Wall","Action","Yimou Zhang","2016-01-01","103","6.1","56036","45.13"
"La La Land","Comedy","Damien Chazelle","2016-01-01","128","8.3","258682","151.06"
"Mindhorn","Comedy","Sean Foley","2016-01-01","89","6.4","2490",""
"The Lost City of Z","Action","James Gray","2016-01-01","141","7.1","7188","8.01"
"Passengers","Adventure","Morten Tyldum","2016-01-01","116","7","192177","100.01"
"Fantastic Beasts and Where to Find Them","Adventure","David Yates","2016-01-01","133","7.5","232072","234.02"
"Hidden Figures","Biography","Theodore Melfi","2016-01-01","127","7.8","93103","169.27"
"Rogue One","Action","Gareth Edwards","2016-01-01","133","7.9","323118","532.17"
"Moana","Animation","Ron Clements","2016-01-01","107","7.7","118151","248.75"
"Colossal","Action","Nacho Vigalondo","2016-01-01","109","6.4","8612","2.87"
"The Secret Life of Pets","Animation","Chris Renaud","2016-01-01","87","6.6","120259","368.31"
"Hacksaw Ridge","Biography","Mel Gibson","2016-01-01","139","8.2","211760","67.12"
"Jason Bourne","Action","Paul Greengrass","2016-01-01","123","6.7","150823","162.16"
"Lion","Biography","Garth Davis","2016-01-01","118","8.1","102061","51.69"
"Arrival","Drama","Denis Villeneuve","2016-01-01","116","8","340798","100.5"
"Gold","Adventure","Stephen Gaghan","2016-01-01","120","6.7","19053","7.22"
"Manchester by the Sea","Drama","Kenneth Lonergan","2016-01-01","137","7.9","134213","47.7"
"Hounds of Love","Crime","Ben Young","2016-01-01","108","6.7","1115",""
"Trolls","Animation","Walt Dohrn","2016-01-01","92","6.5","38552","153.69"
"Independence Day: Resurgence","Action","Roland Emmerich","2016-01-01","120","5.3","127553","103.14"
"Paris pieds nus","Comedy","Dominique Abel","2016-01-01","83","6.8","222",""
"Bahubali: The Beginning","Action","S.S. Rajamouli","2015-01-01","159","8.3","76193","6.5"
"Dead Awake","Horror","Phillip Guzman","2016-01-01","99","4.7","523","0.01"
`;

const schema = [
  {
    name: "Title",
    type: "dimension",
    subtype: "categorical",
  },
  {
    name: "Genre",
    type: "dimension",
    subtype: "categorical",
  },
  {
    name: "Director",
    type: "dimension",
    subtype: "categorical",
  },
  {
    name: "Year",
    type: "dimension",
    subtype: "temporal",
    format: "%Y-%m-%d",
  },
  {
    name: "Runtime (Minutes)",
    type: "measure",
    subtype: "continuous",
    defAggFn: "avg",
  },
  {
    name: "Rating",
    type: "measure",
    subtype: "continuous",
    defAggFn: "avg",
  },
  {
    name: "Votes",
    type: "measure",
    subtype: "continuous",
    defAggFn: "sum",
  },
  {
    name: "Revenue (Millions)",
    type: "measure",
    subtype: "continuous",
    defAggFn: "sum",
  },
];

const formattedData = await DataModel.loadData(data, schema);
const dm = new DataModel(formattedData);

const SpawnableSideEffect = muze.SideEffects.standards.SpawnableSideEffect;

muze
  .canvas()
  .rows(["Revenue (Millions)"])
  .columns(["Genre"])
  .config({
    interaction: {
      singleSelect: {
        sideEffects: {
          "data-grid": {
            enabled: true,
          },
        },
      },
    },
  })
  .title("Revenue By Genre")
  .subtitle("Double click on bars to see data")
  .data(dm)
  .width(800)
  .height(800)
  .mount("#chart");

const { VolatileBehaviour } = muze.Behaviours.standards;

muze.ActionModel.for(canvas)
  .registerPhysicalActions({
    /* to register the action */
    doubleClick: (firebolt) => (targetEl) => {
      targetEl.on("dblclick", function (data) {
        const event = muze.utils.getEvent();
        const mousePos = muze.utils.getClientPoint(this, event);
        const payload = firebolt.getPayloadFromEvent("doubleClick", mousePos, {
          data,
          event,
        });

        firebolt.triggerPhysicalAction("doubleClick", payload);
      });
    },
  })
  .registerBehaviouralActions(
    class SingleSelectBehaviour extends VolatileBehaviour {
      static formalName() {
        return "singleSelect";
      }
    },
  )
  .registerPhysicalBehaviouralMap({
    doubleClick: {
      behaviours: ["singleSelect"],
    },
  })
  .registerSideEffects(
    class DataGrid extends SpawnableSideEffect {
      constructor(...params) {
        super(...params);
        if (this.firebolt.target() === "visual-unit") {
          this.disable();
        }
      }

      static formalName() {
        return "data-grid";
      }

      apply(selectionSet) {
        const model = selectionSet.entrySet.model;
        if (!model) {
          removeDataGrid();
          return this;
        }

        const selectDm = canvas.data().select({
          field: canvas.columns()[0],
          value: model.getField(canvas.columns()[0]).data()[0],
          operator: "eq",
        });

        const { data, schema } = selectDm.getData({
          excludeFields: ["__id__"],
        });

        // Format the data
        formatData(data);

        // Dispose the datamodel
        selectDm.dispose();

        // Show table
        showDataGrid({ data, schema }, canvas);
      }
    },
  );

function formatData(data) {
  data.forEach((arr, index) => {
    arr.forEach((value, columnIndex) => {
      if (schema[columnIndex].subtype === "temporal") {
        data[index][columnIndex] = DataModel.DateTimeFormatter.formatAs(
          value,
          "%Y-%m-%d",
        );
      } else {
        data[index][columnIndex] =
          value instanceof DataModel.Invalid ? "No data" : value;
      }
    });
  });
}

function showDataGrid({ data, schema }, canvas) {
  removeDataGrid();

  // Get chart container
  const chart = document.getElementById("chart");

  // Create modal container
  const modal = document.createElement("div");
  modal.id = "modal";
  modal.style.position = "fixed";
  modal.style.top = "50%";
  modal.style.left = "50%";
  modal.style.transform = "translate(-50%, -50%)";
  modal.style.backgroundColor = "white";
  modal.style.padding = "20px";
  modal.style.boxShadow = "0 4px 8px rgba(0, 0, 0, 0.2)";
  modal.style.zIndex = "1000";
  modal.style.borderRadius = "8px";
  modal.style.overflow = "hidden";
  modal.style.maxHeight = "50%";
  modal.style.display = "flex";
  modal.style.flexDirection = "column";

  // Create close button
  const closeIcon = document.createElement("span");
  closeIcon.innerHTML = "×";
  closeIcon.style.position = "sticky";
  closeIcon.style.top = "0";
  closeIcon.style.right = "0";
  closeIcon.style.margin = "10px 0";
  closeIcon.style.fontSize = "24px";
  closeIcon.style.fontWeight = "bold";
  closeIcon.style.cursor = "pointer";
  closeIcon.style.alignSelf = "flex-end";
  closeIcon.style.color = "#333";
  closeIcon.style.zIndex = "1001";
  closeIcon.onclick = () => {
    chart.removeChild(overlay);
    canvas.firebolt().dispatchBehaviour("singleSelect", {
      criteria: null,
    });
  };

  modal.appendChild(closeIcon);

  // Create table container
  const tableContainer = document.createElement("div");
  tableContainer.style.overflowY = "auto";
  tableContainer.style.flex = "1";

  // Create table
  const table = document.createElement("table");
  table.id = "table";
  table.style.width = "100%";
  table.style.borderCollapse = "collapse";

  // Add table headers
  const thead = document.createElement("thead");
  thead.style.position = "sticky";
  thead.style.top = "0";
  thead.style.backgroundColor = "#f2f2f2";
  thead.style.zIndex = "1001";

  const headers = schema.map((d) => d.name);
  const headerRow = document.createElement("tr");
  headers.forEach((header) => {
    const th = document.createElement("th");
    th.textContent = header;
    th.style.border = "1px solid #ddd";
    th.style.padding = "8px";
    th.style.textAlign = "left";
    headerRow.appendChild(th);
  });
  thead.appendChild(headerRow);
  table.appendChild(thead);

  // Add table rows
  const tbody = document.createElement("tbody");
  data.forEach((row) => {
    const tr = document.createElement("tr");
    row.forEach((cell) => {
      const td = document.createElement("td");
      td.textContent = cell;
      td.style.border = "1px solid #ddd";
      td.style.padding = "8px";
      tr.appendChild(td);
    });
    tbody.appendChild(tr);
  });
  table.appendChild(tbody);

  tableContainer.appendChild(table);
  modal.appendChild(tableContainer);

  // Create overlay
  const overlay = document.createElement("div");
  overlay.id = "overlay";
  overlay.style.position = "fixed";
  overlay.style.top = "0";
  overlay.style.left = "0";
  overlay.style.width = "100%";
  overlay.style.height = "100%";
  overlay.style.backgroundColor = "rgba(0, 0, 0, 0.5)";
  overlay.style.zIndex = "999";

  overlay.appendChild(modal);
  chart.appendChild(overlay);
}

function removeDataGrid() {
  const overlay = document.getElementById("overlay");
  if (overlay) document.removeChild(overlay);
}